Aiball's
statistics
Position, coordination and coverage
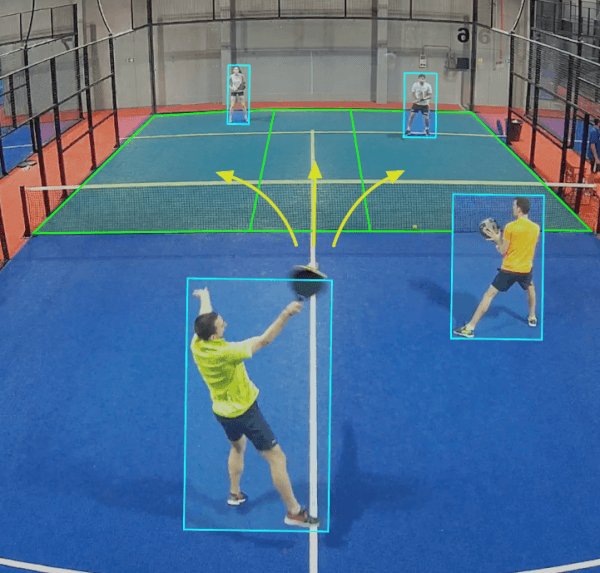
Position in court areas: percentage of game time that the player has been in the volley zone (between 0 and 5 metres from the net), in the transition zone (between 5 and 7 metres from the net), and in the baseline zone (behind the service line).
Individual
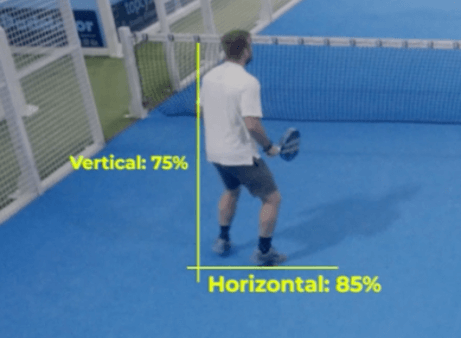
Horizontal coverage: Percentage of time that the player is positioned horizontally on court in a way that maximises the probability of finishing the point or defending it, with respect to the positioning of the opponents.
Vertical coverage: Percentage of the time the player is positioned vertically (volley to baseline) on court in a way that maximises the probability of finishing the point or defending the point, relative to the positioning of the opponents. For example, if both opponents are at the baseline of the court, the maximum vertical coverage would be reached when positioning ourselves in volley.
Per pair
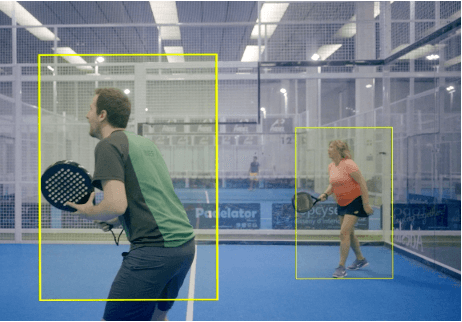
Horizontal tilting: percentage of the time in which the two players of the team have coordinated to cover the court horizontally. To do this, the players have to position themselves in regions of the court where they can cover the spaces. Thus, when the opposing team hits the ball, the player in front of the opponent who hits it must be perpendicular to the opponent (within a range of 3 metres) and his/her partner must be between 3 and 5 metres away. For example, if the opposing player hits the ball 3 metres from the left side wall, the players of the receiving team must be between 1 and 4 metres and between 5 and 7 metres from the left wall and no more than 5 metres away from each other. Vertical tilting: Percentage of time in which the two players of the team have coordinated properly to go up to the net and back, covering the court vertically. To do this, the players have to be simultaneously in defence (baseline) or attack (volley) according to each moment of the game and the position of the opponents. Thus, it is penalised to be in different areas of the court, to be in a transition zone or to be in defensive zones when the opponents are also in defensive zones.Strokes
Stroke distribution: percentage of the player’s strokes that were directed at the opponent’s forehand player, the centre and the opponent’s backhand player.
Good placement: percentage of the player’s hits that forced the opposing player to move 2 metres or more in order to return the ball (or try to return the ball if he/she did not succeed).
First serve accuracy: percentage of serves in which the first serve was valid. Serves speed: Average speed in km/h of the player’s serves.
Distribution of serves: percentage of serves sent to the side wall, to the centre (“T” zone) and to the opponent’s body.
Stroke Variety
Percentage of each type of stroke that the player has made during the match according to the following classification:
Lob: Parabolic shots where the ball surpasses the 2.5m high and which are typically executed from the last 5m of the court with the intention of going beyond the opponents from above, forcing them to step back to back court positions.
Groundstroke: A shot hit from the back of the court without the ball reaching a height of more than 2.5m along its trajectory.
Volley: A shot hit close to the net (less than 5 metres from the net) where the ball is hit before it bounces on the ground.
Bandeja /víbora: Offensive strokes where the ball is hit from top to bottom with a speed of over 20 km/h and under 65 km/h, typically hitting the ball over the shoulders. In this category strokes such as bandejas and víboras are included.
Smash: Offensive strokes where the ball is hit from top to bototm with a speed higher than 65 km/h, typically hitting the ball over the shoulders. In this category we include strokes with the intention of returning the ball to one’s own court; strokes that get the ball over fence (out by 3 metres, and out by 4 metres).
How are the statistics in the WPT?
Get to know the Aiball’s stats applied to WPT players. This way you can compare yourself with the best players and identify your strengths and weaknesses.
| Key Statistics | WPT Womens’s | WPT Men’s |
|---|---|---|
| Match data |
||
| Time per point (seconds) | Between 12 and 16 | Between 9 and 13 |
| Hits per point | Between 12 and 15 | Between 8 and 12 |
| Positioning |
||
| Time in volley zone | 40-50% | |
| Time in transition zone | 15-20% | |
| Time in back court | 35-45% | |
| Individual coverage | ||
| Horizontal coverage | 85-95% | |
| Vertical coverage | 90-95% | |
| Pair coordination | ||
| Horizontal tilting | 85-90% | |
| Vertical tilting | 85-90% | |
| Strokes | ||
| Hits to uncovered areas | 40-50% | |
| First serve accuracy | >90% | |
| Serving speed | 60-70 km/h | |
| Hits to the centre | 30-35% | |